Contact-rich manipulation represents a class of complex robotic interaction tasks where precise control is achieved through physical contact with the environment. Among these tasks, vegetable peeling stands out as a representative and practical example, combining high-level manipulation challenges with real-world applicability. It serves as an ideal testbed for exploring robotic strategies that rely heavily on force interaction and compliance.
While vision-based approaches have been widely adopted, their limitations in contact-rich tasks have led to growing interest in multi-modal sensing, particularly the integration of force and tactile feedback. By incorporating force information, robots can significantly enhance stability, adaptability, and success rates when dealing with tasks involving uncertain dynamics and fine surface interactions.
This project focuses on the vegetable peeling task and proposes a complete research framework spanning multi-modal data acquisition, policy learning, control execution, and performance evaluation. Specifically, we:
-
Designed a VR-based multi-modal data collection system and built a task dataset combining visual and force signals;
-
Developed CNN-based and Mamba-based diffusion policy learning models that fuse visual and force information;
-
Designed compliant and adaptive control strategies;
-
Conducted comprehensive experiments to evaluate and compare model performance.
A demonstration video of the final result is below.
1. Design of a VR Teleoperation Data Collection System and Dataset Construction
1.1 Experimental Platform
As the core carrier of data acquisition, the experimental platform has perfect multimodal perception functions and can fully support the realization of complex operation tasks. The key module composition of the experimental platform is shown in Figure 1.1.
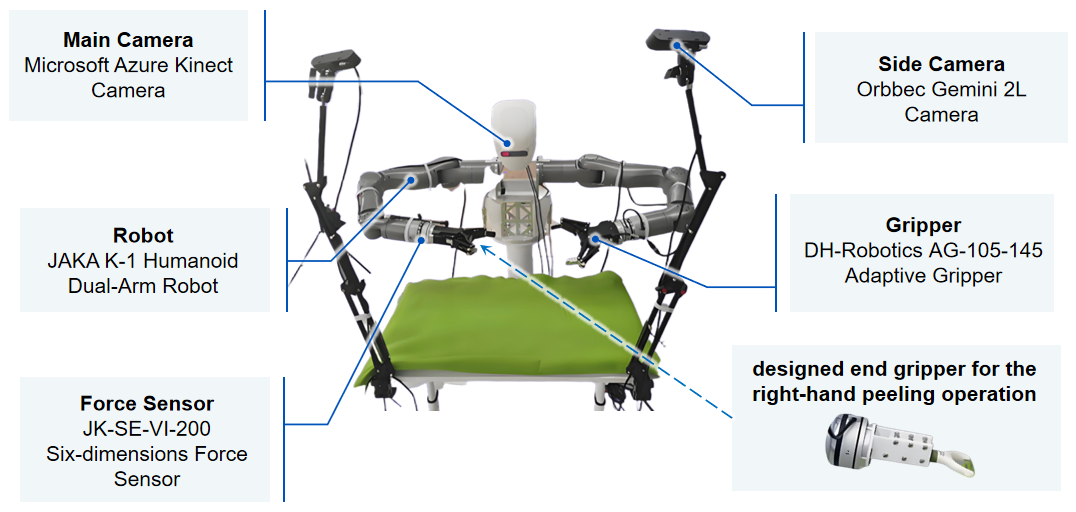
Figure 1.1: Experimental Platform
1.2 VR Teleoperation System
The overall architecture of the VR teleoperation system is shown in Fig 1.2, and the system consists of four main parts: the VR, the camera, the PC and the robot. The VR glasses receive images from the head camera and render them on the scene canvas in real time to provide an immersive visual experience, and the VR handle is responsible for releasing the key and pose information. The keys include the start button, the stop button and the grasp button. The real-time pose change information of the VR handle is converted into the expected pose of the robot end effector through mapping to realize the teleoperation control. The final saved data include RGB images and depth images from the three cameras (collected at 10 Hz), low-frequency data from the dual-arm robot (collected at 6 Hz), and high-frequency data (collected at 60 Hz). The low-frequency data contains the robot’s end pose, joint angle, and gripper state, and the high-frequency data contains the robot’s end force and moment, end pose, and joint angle.
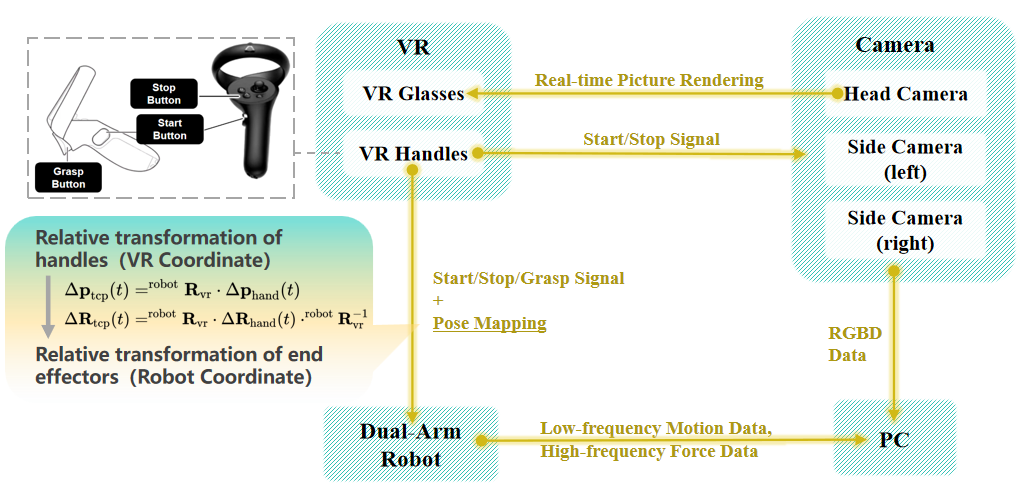
Figure 1.2: VR System
1.3 Dataset Construction
Based on the VR teleoperated system, data acquisition was performed for the vegetable peeling task of zucchini, and a dataset containing 100 pieces of high-quality peeling data was created. The architecture of the raw dataset is shown in Figure 1.3. The image data includes color images and depth images (collected at 30Hz). The low-frequency data included the pose of robot end effector, the angle of each joint, and the the gripper state (collected at 6 Hz). High-frequency data includes force sensor data, robot end effector pose, and the angle of each joint (collected at 60Hz).
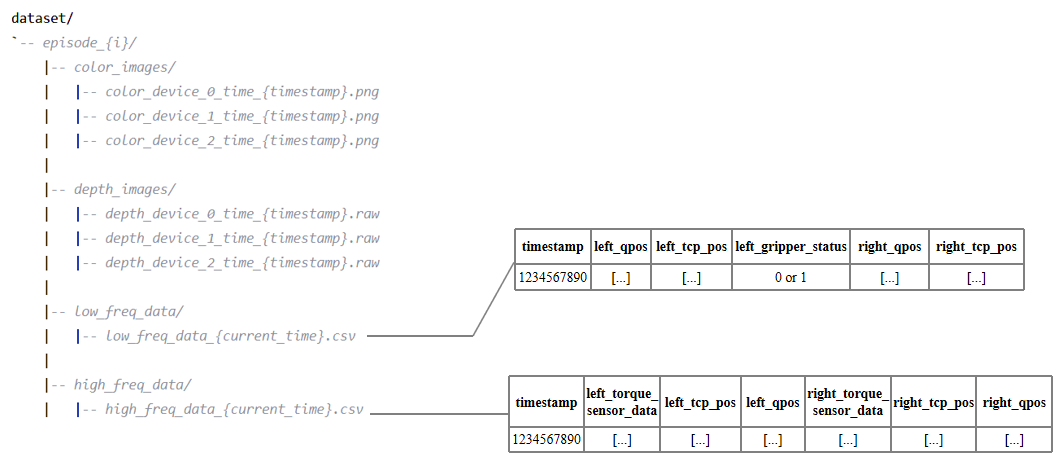
Figure 1.3: Raw Dateset Structure
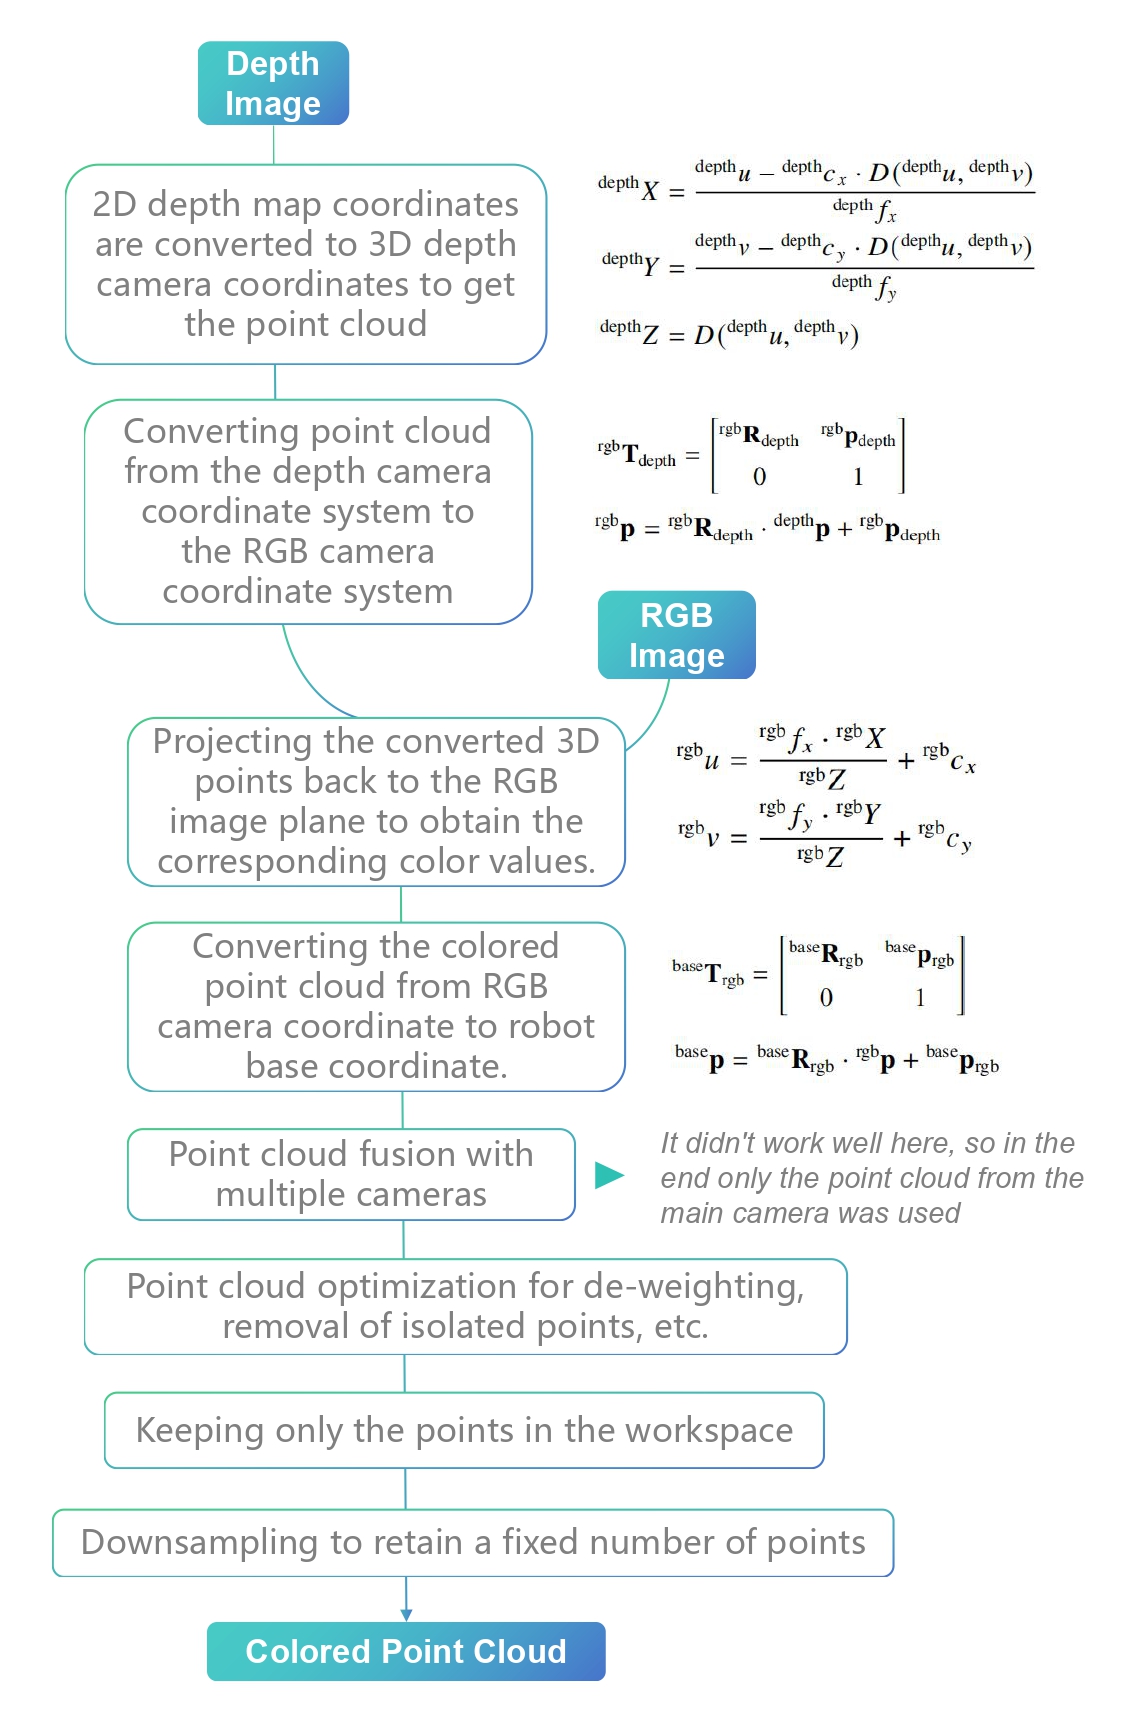
Figure 1.4: Point Cloud Reconstruction Process
The data is organized into a HDF5 file in robomimic format and the overall architecture is shown in Figure 1.5.

Figure 1.5: HDF5 Dataset Structure
2. Development and Training of Diffusion Policy Models
This study employed the CNN-based Diffusion Policy and the Mamba-based Diffusion Policy (subsequently referred to as Diffusion-C and Diffusion-M), and the overall model architecture is shown in Figure 2.1. Two models were trained separately, with a batch size of 32 and an epoch number of 1000. Finally, the model generated after 800 epochs was selected for testing.
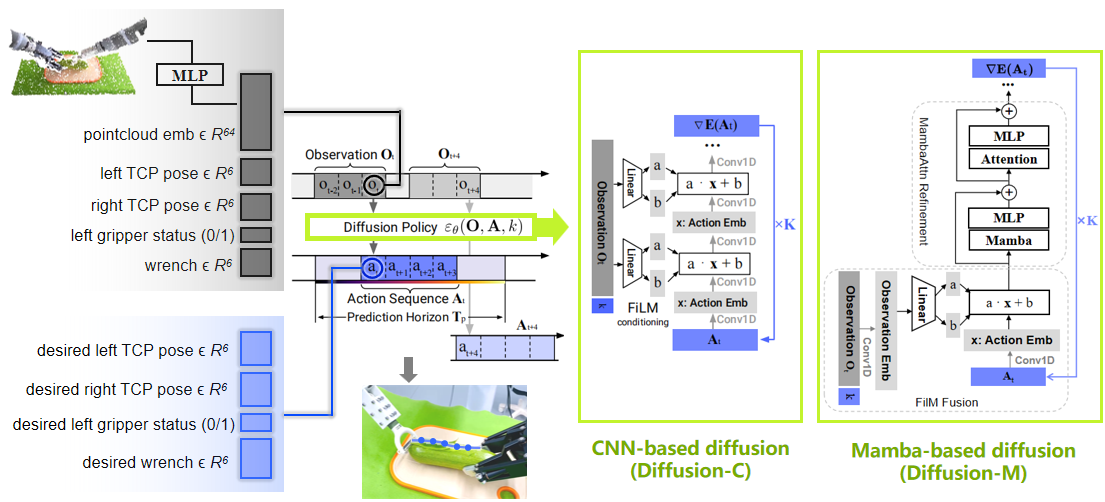
Figure 2.1: Model Architecture (Adapted from
Diffusion Policy and
Mamba Policy)
3. Task Execution and Performance Evaluation on Vegetable Peeling
3.1 Compliant Adjustment Strategy
We design a compliant adjustment strategy that organically combines the pose parameters and force/torque parameters output from the model to achieve better control. The core idea is to adjust the desired pose of the robot in real time to reduce the error between the actual force/torque and the expected force/torque. The overall flow is shown in Figure 3.1.
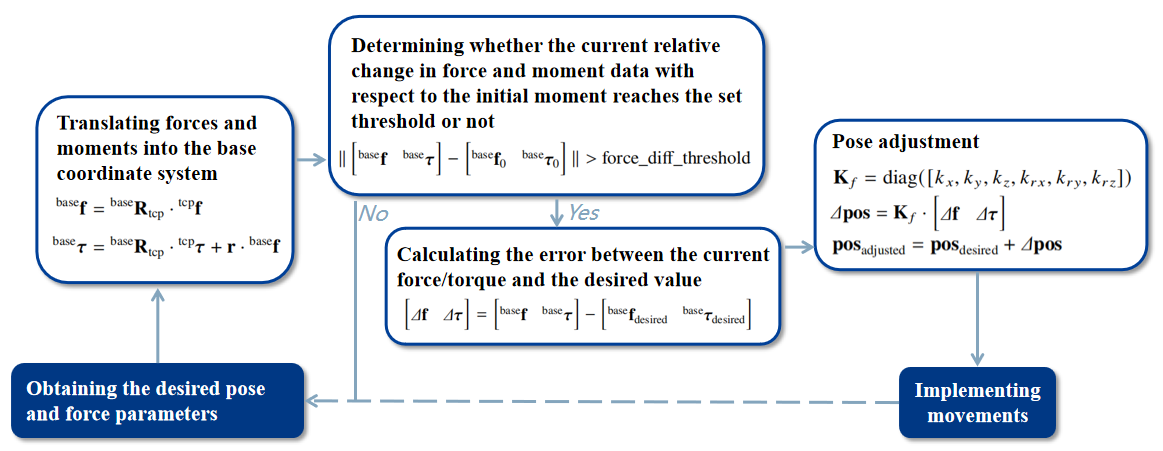
Figure 3.1: Compliant Adaption Flow
Comparison experiments of force following with or without the strategy were conducted for the Diffusion-C and Diffusion-M models, respectively, focusing on examining the actual force/torque following the expected force/torque after using the compliant adjustment strategy (Figure 3.2, Figure 3.3). In the figures, the curves labeled “1” represent the results without the compliant adjustment strategy, while the curves labeled “2” represent the results with the compliant control strategy.
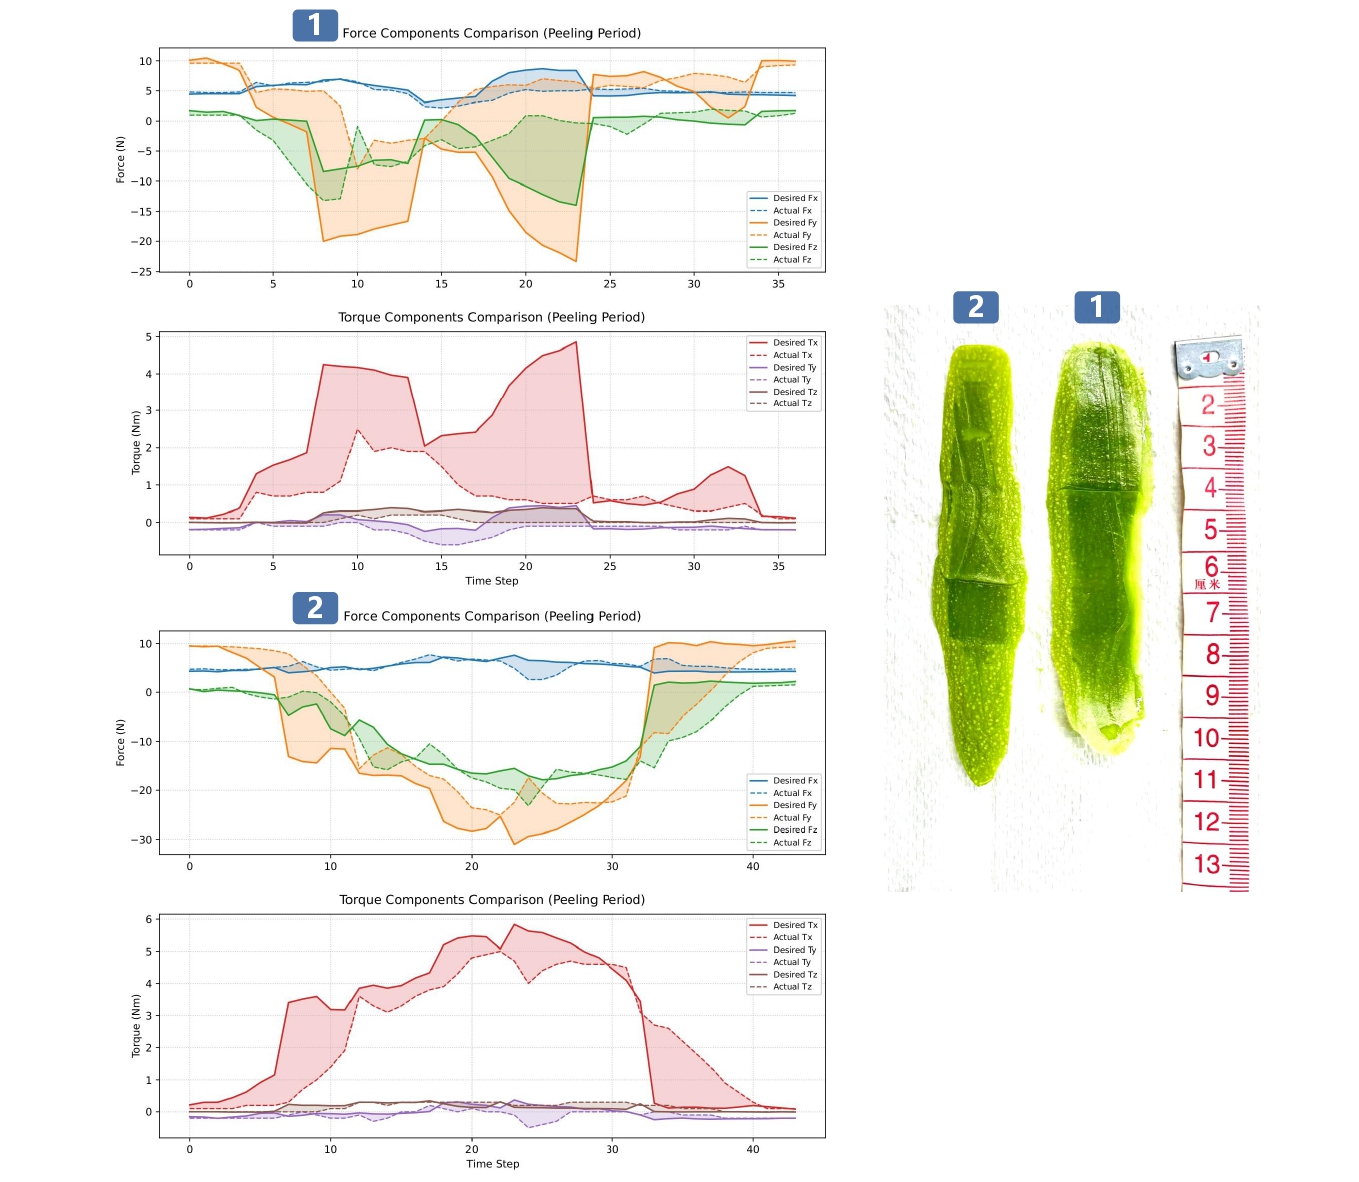
Figure 3.2: Comparison of Force/Torque Curves for Diffusion-C with and Without Compliant Adjustment Strategy
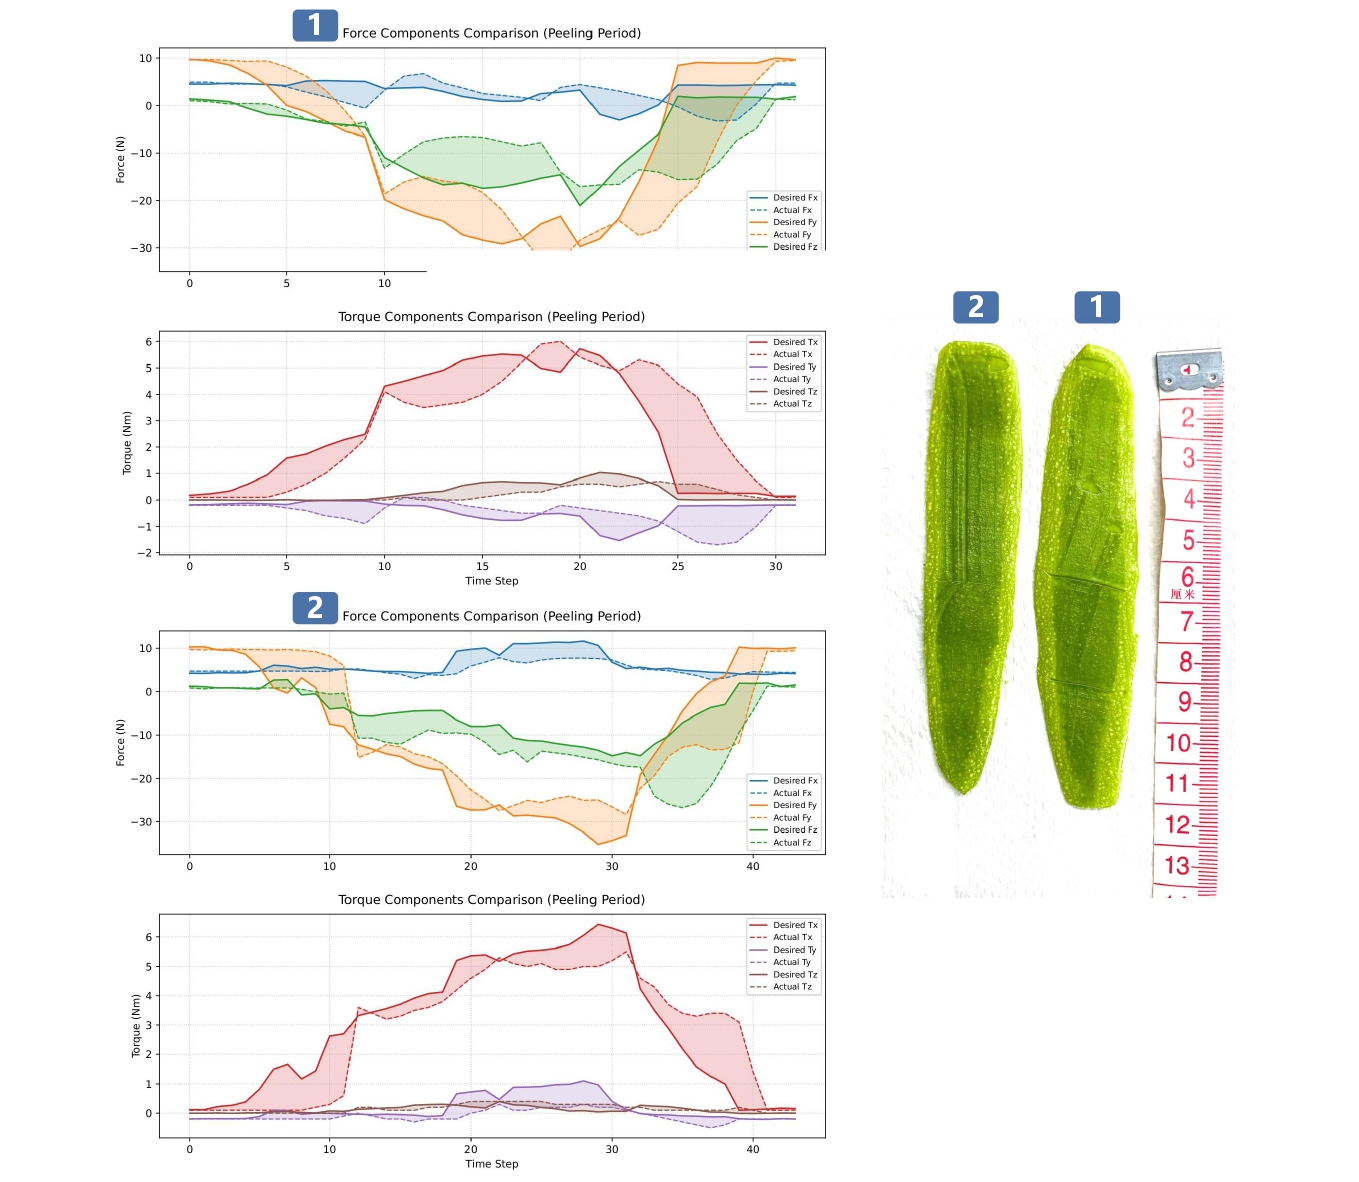
Figure 3.3: Comparison of Force/Torque Curves for Diffusion-M with and Without Compliant Adjustment Strategy
3.2 Model Performance Evaluation and Comparison
The following four quantitative indicators were designed:
- Success Rate: the ratio of the number of successful peeling tasks performed to the total number of tasks performed.
- Peeling Length: the mean and standard deviation of the statistical peeling length in successfully completed peeling tasks.
- Total Movement Efficiency: the mean and standard deviation of 100 time points divided by the total time points of the positioning and peeling phases were counted. The expression is:
$$ \begin{aligned} \text{motion_efficiency} &= \frac{100}{\text{time_step_total}}\\ \text{time_step_total} &= \frac{t_{\text{locate}}+t_{\text{peel}}}{t_{\text{send}}+t_{\text{inference}}+t_{\text{move}}} \end{aligned} $$
- Peeling Efficiency: the peeling length is divided by the time points of the peeling phase, i.e. the peeling length per unit time step, and its mean and standard deviation are counted. The expression is:
$$ \begin{aligned} \text{peeling_efficiency} &= \frac{\text{length}}{\text{time_step_peel}}\\ \text{time_step_peel} &= \frac{t_{\text{peel}}}{t_{\text{send}}+t_{\text{inference}}+t_{\text{move}}} \end{aligned} $$
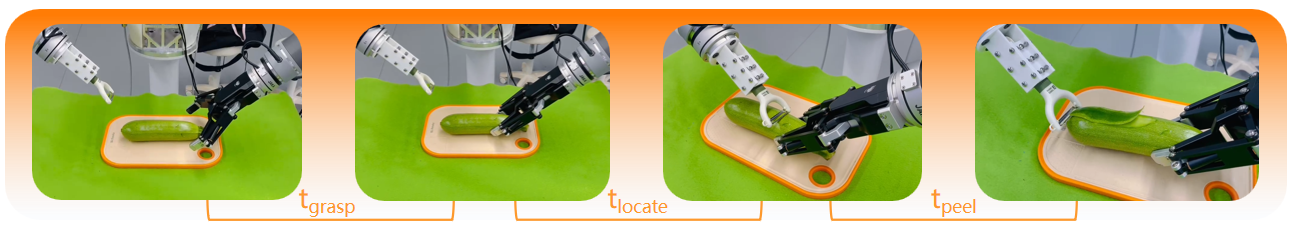
Figure 3.4: Peeling Task Stage Division
In order to fully evaluate the performance of the Diffusion-C and Diffusion-M models with and without the compliant adjustment strategy, we performed 32 peeling inference tasks for each of the four model combinations. Figure 3.5 illustrates a visual record of some of the test results.
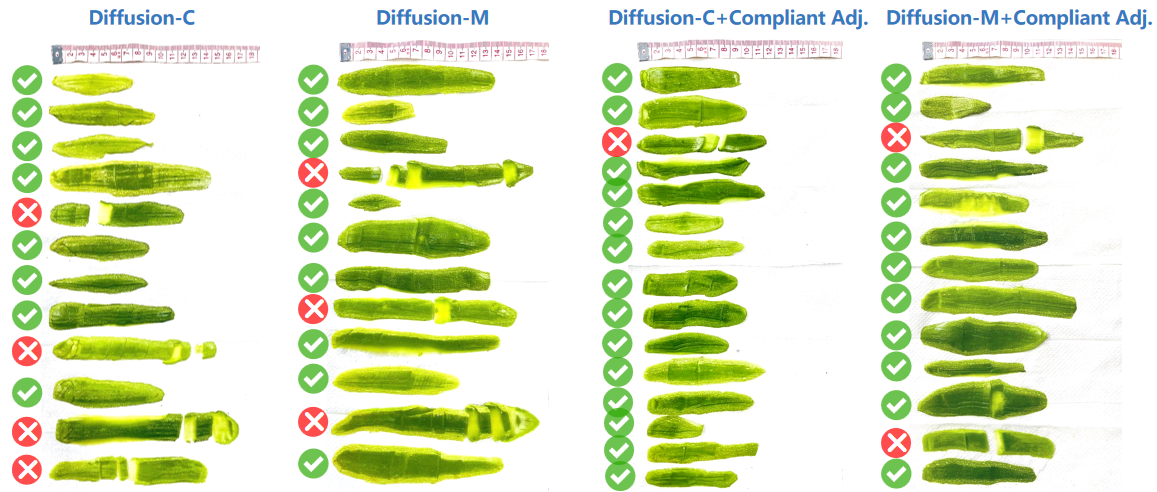
Figure 3.5: Partial Peeling Test Results Record
Table 3.1 demonstrates the statistics of the four quantitative indicators. Figures 3.6, 3.7 and 3.8 show the distribution of peeling length, total motion efficiency and peeling efficiency respectively.
Table 3.1: Comparison of Quantitative Indicators
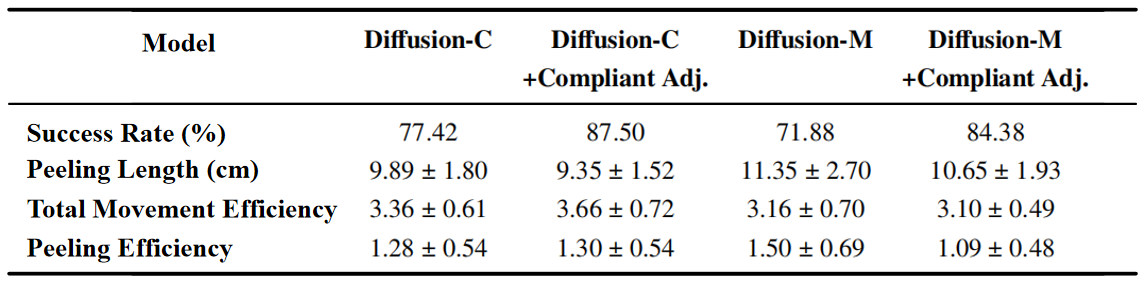
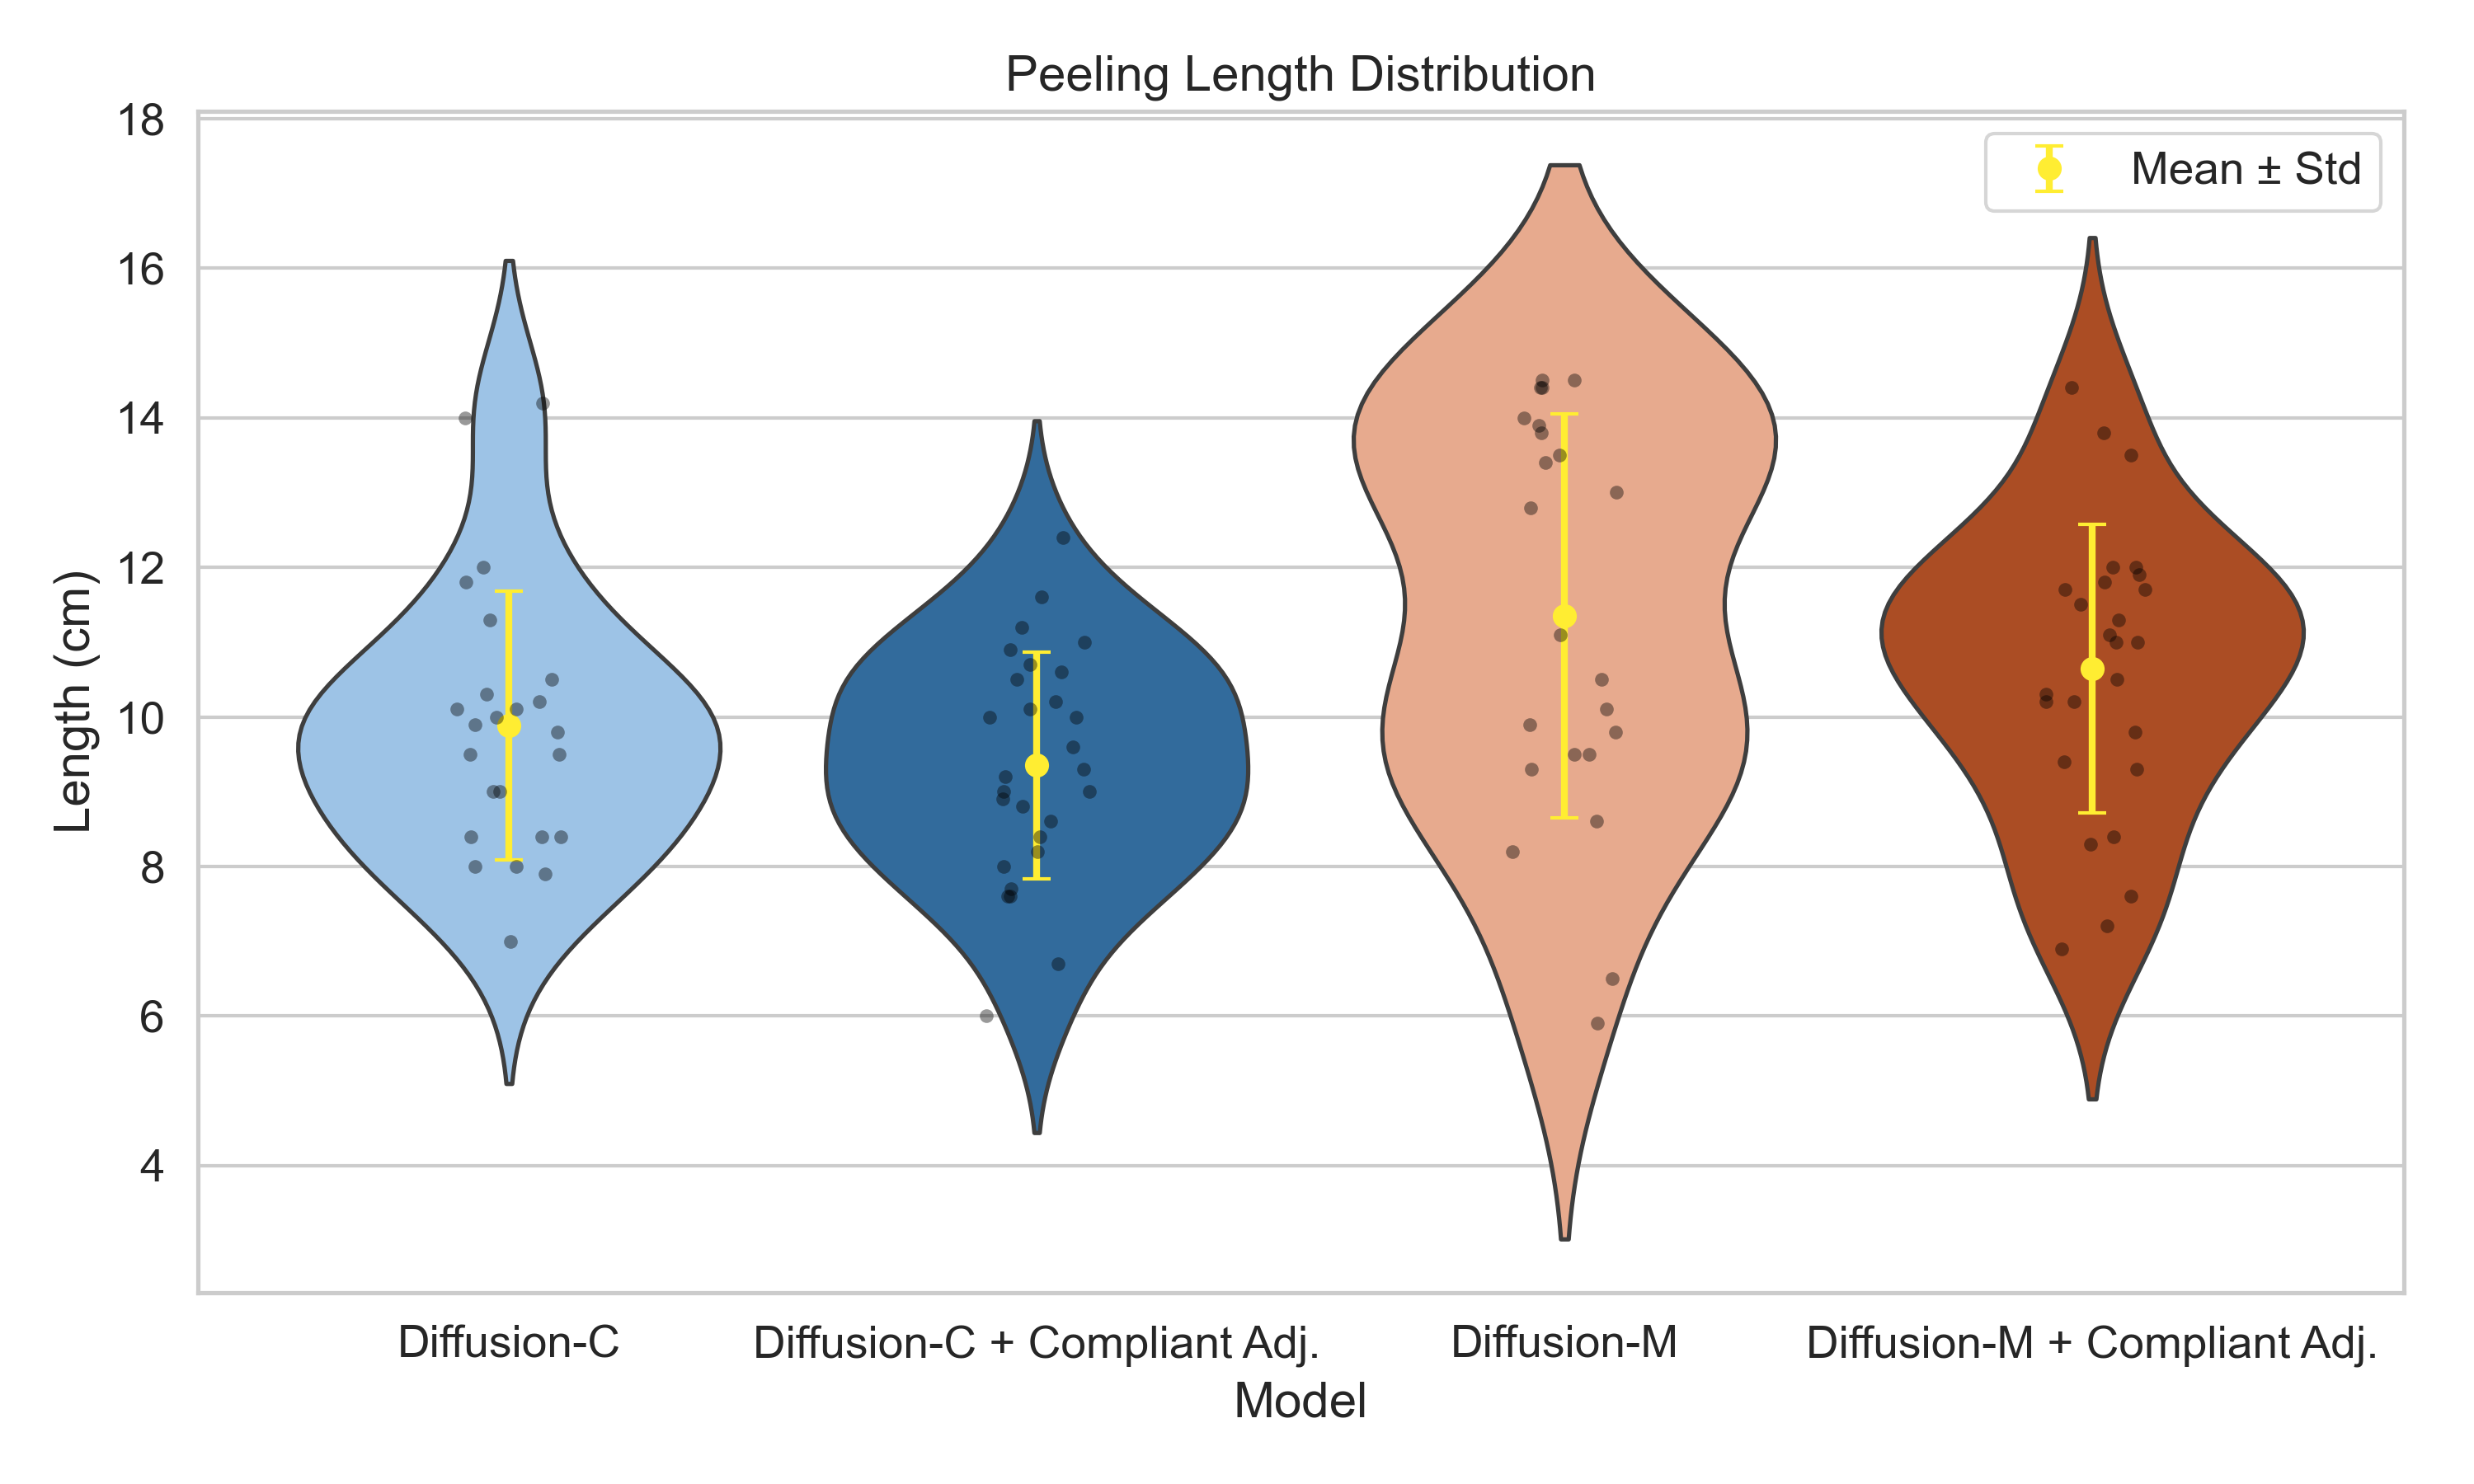
Figure 3.6: Distribution of Peeling Length
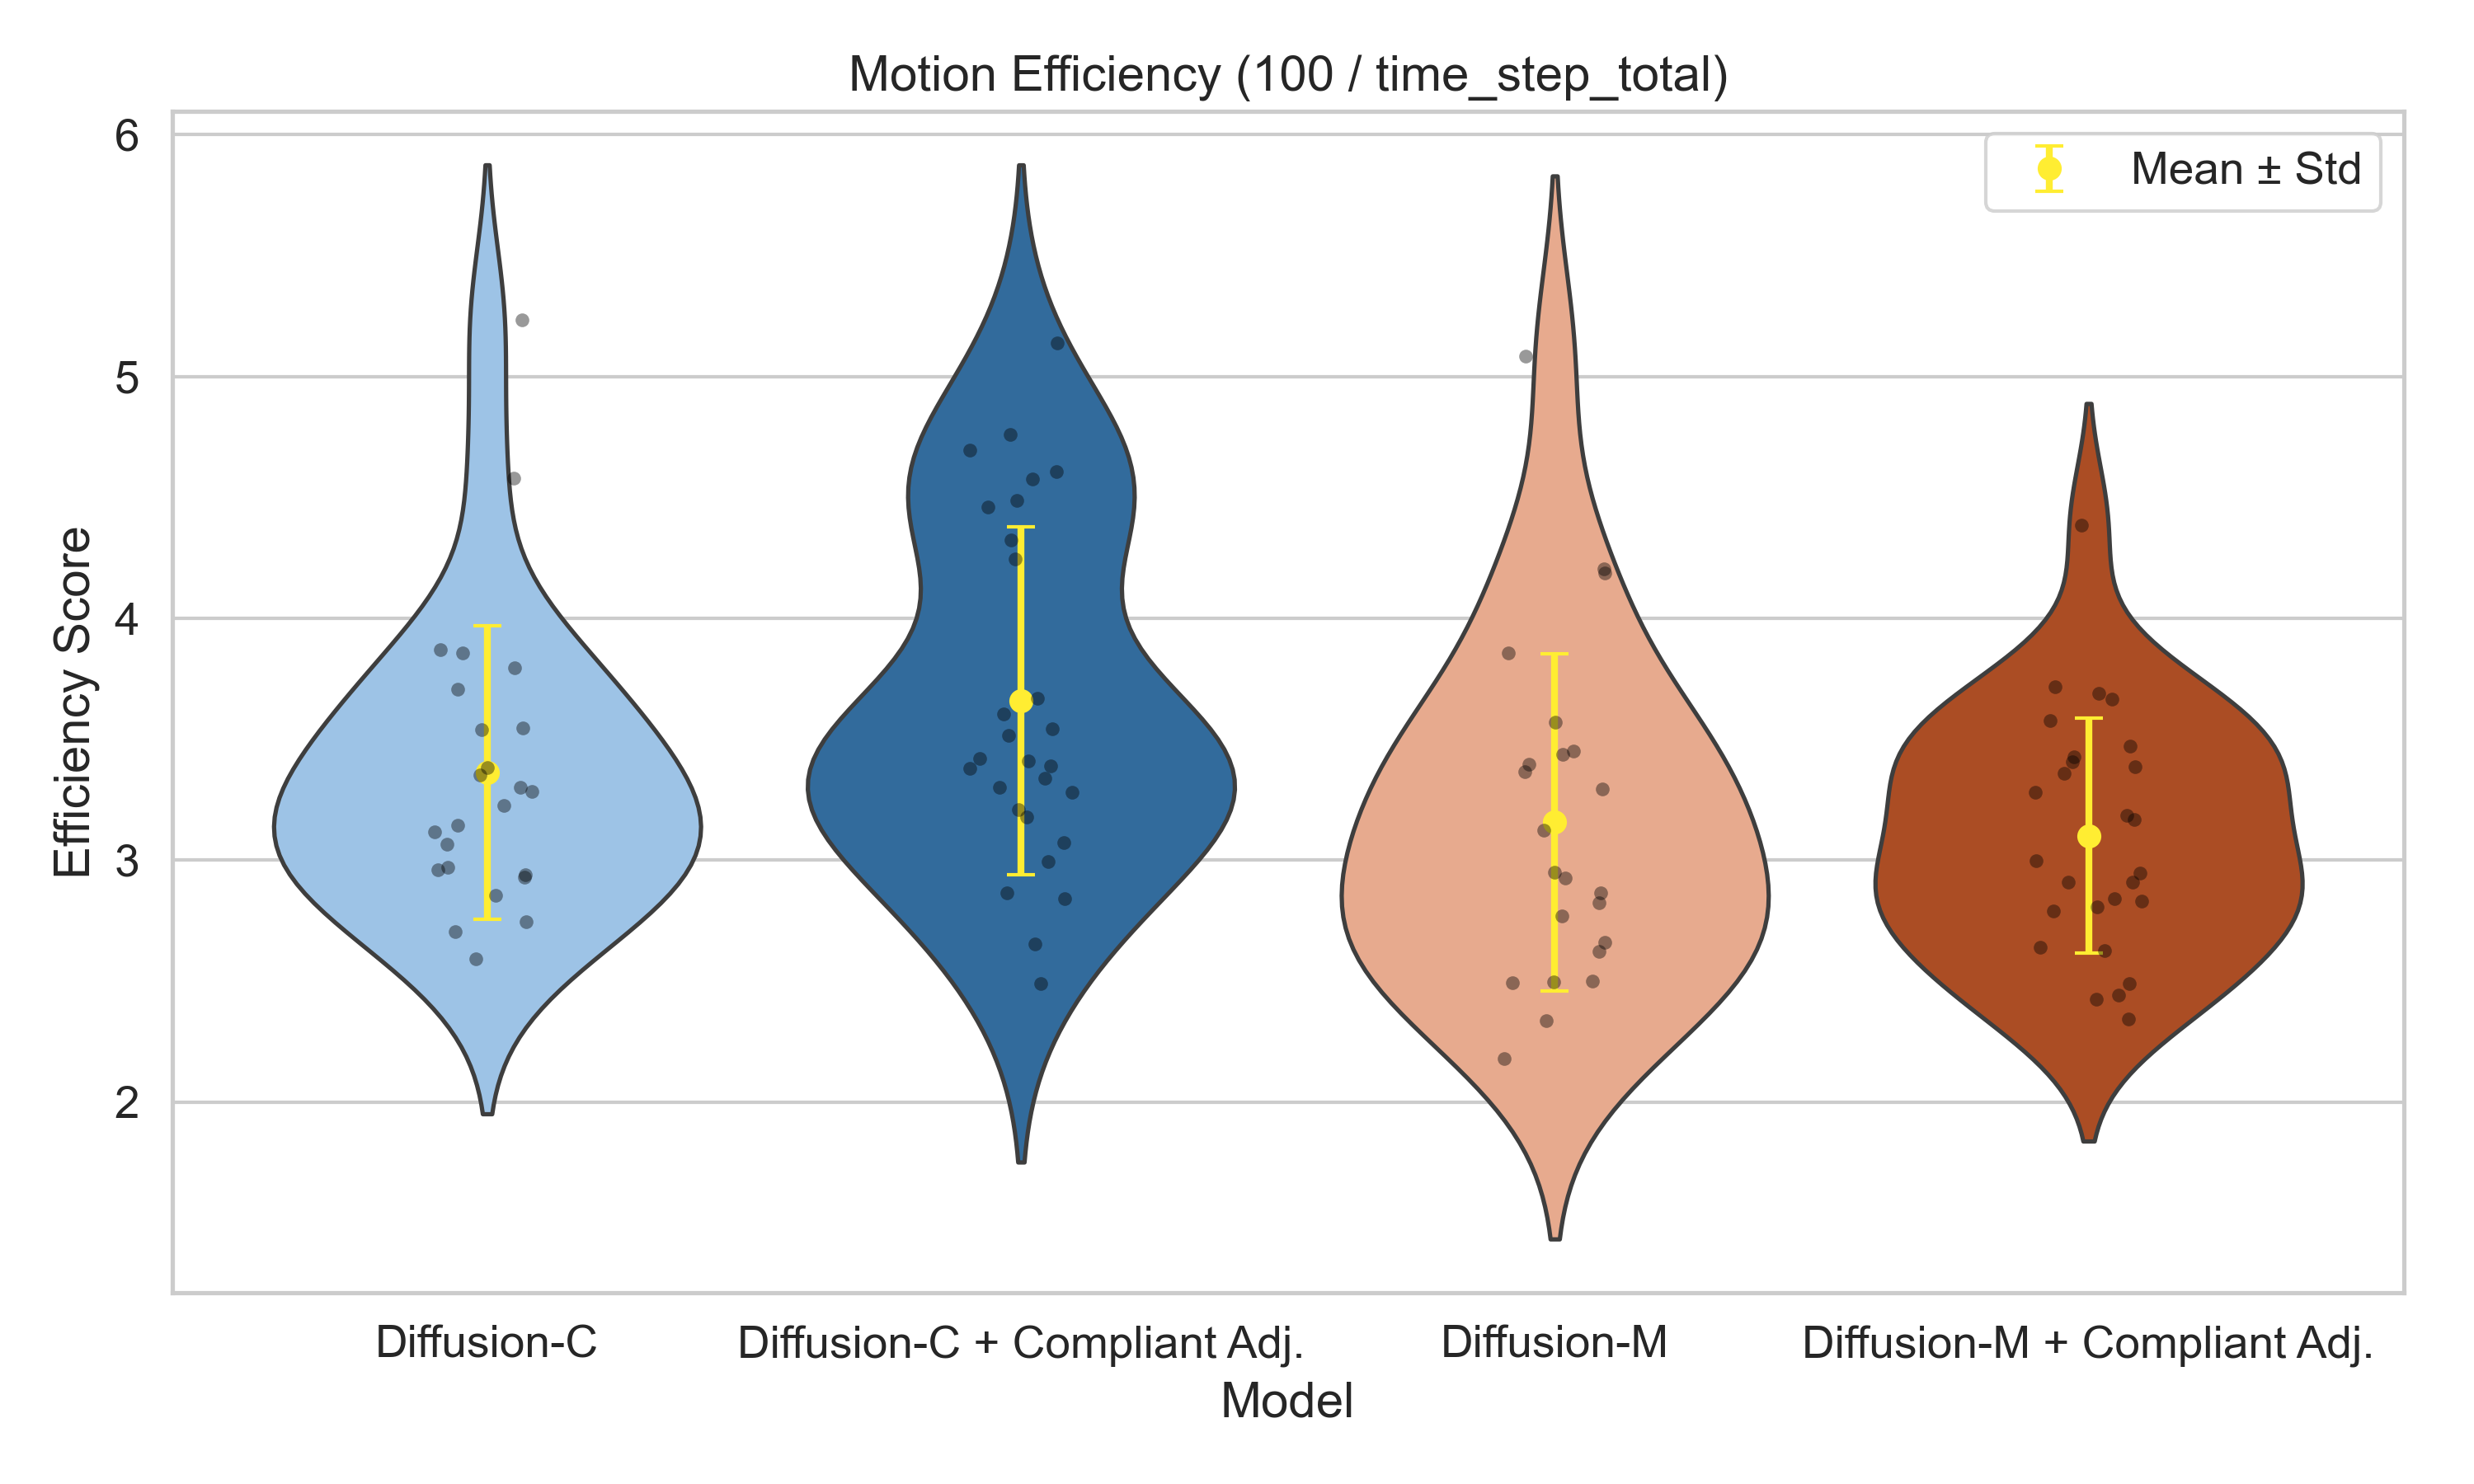
Figure 3.7: Distribution of Total Motion Efficiency
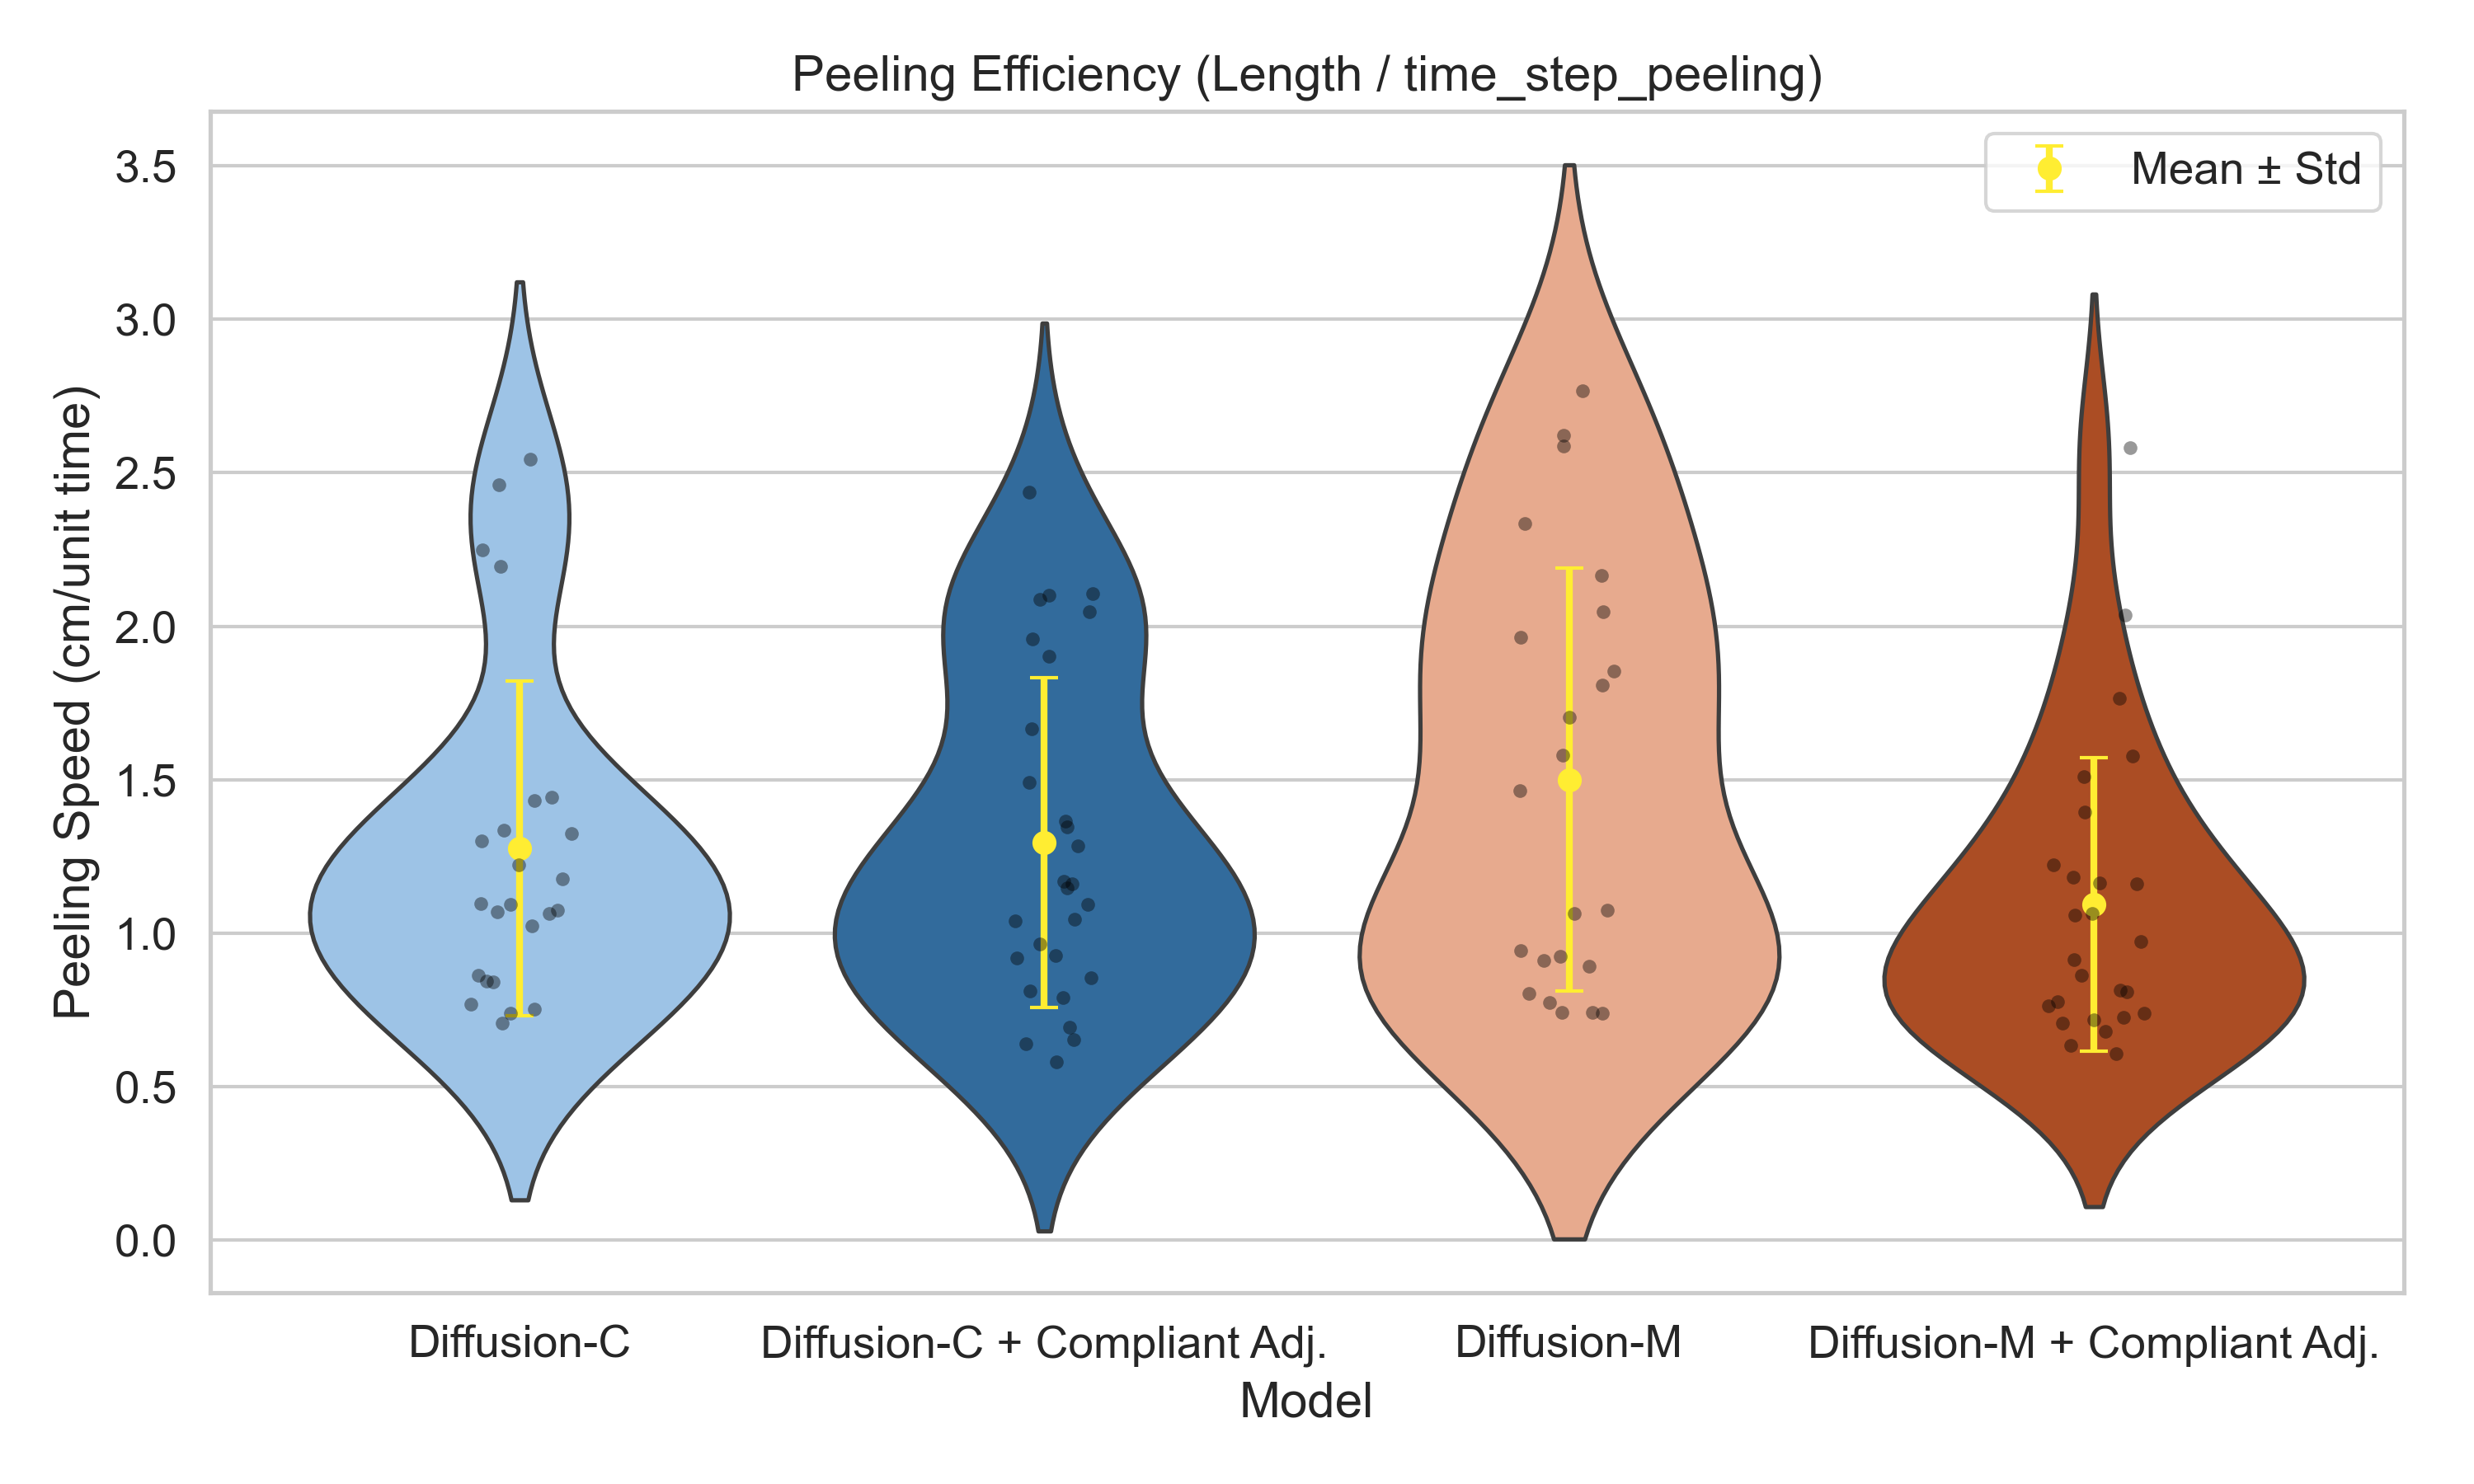
Figure 3.8: Distribution of Peeling Efficiency
From the comparison, we draw the following conclusions:
- Diffusion-C demonstrates more stable performance, while Diffusion-M yields more visually impressive results but suffers from reduced consistency.
- Compliant adjustment significantly improves system stability, though it compromises the “brute-force” effects to some extent.
- Diffusion-C is more time-efficient overall.
- Diffusion-C produces more conservative position outputs, where incorporating force prediction helps accelerate the peeling process; in contrast, Diffusion-M generates more aggressive motions, and force prediction helps slow down the process and enhance stability.